
10/27/2026
The short answer is, “yes, AI can help!”
However, let’s agree that the first answer we need is which members do not churn. Who is loyal? Who is low-risk?
It’s easier to prove a negative case when we know which markers correlate to a positive case. Let’s give an example from emergency medicine, since that’s how I spend a lot of my non-Strategico hours.
Before I do that, I want to thank Jeremy Furniss, the VP of Membership Development and Data Science from the American Occupational Therapy Association. Not only did Jeremy help me check and develop my thinking, but he has also tolerated endless metaphors from my work in EMS as it relates to technology and membership-based organizations.
Now for the EMS analogy.
When assessing for stroke-like symptoms, Maryland protocol requires us to do a couple of different kinds of tests. One of those tests is a LAMS score – or Los Angeles Motor Scale. This scale gauges severity of symptoms. With each finding in three categories, the score increases. By 1) knowing the most common symptoms of a stroke, and by 2) being able to assess if those symptoms are present, we can then go on to establish probability of a very negative condition (a stroke). In other words, we establish positive markers (what is normal) and negative (what is the absence of normal).
- Here is how we can apply the same concept to AI and member churn.
AI excels as it learns, and we (and our AI tools) learn by receiving inputs and having a framework for drawing conclusions based on those inputs – positive markers and negative markers. Like a LAMS score, it’s important for us to teach our tools how to recognize and place value on the markers that indicate a healthy member so that we know what an unhealthy member looks like.
Start small.
- Subset of members rather than working with your largest data sets
- Establish length of membership. (maybe derived from join date)
- Or, if that’s not doable, consider over a known period of time.
- Now add other known healthy markers:
Other common markers include the following:
- Attend annual meeting
- Attend at least x events per year
- Complete customer profile
- Service on at least one volunteer committee or group
Other common markers include the following:
Here is an example of how that data looks. This is data that Claude generated for me so that I don’t expose any proprietary information.
|
Member ID |
Member Name |
Years as Member |
Committee Member |
Attends Annual Meeting |
Registered for Webinar |
Engagement Score |
|
M0001 |
Diego Schmidt |
19 |
Yes |
No |
No |
1 |
|
M0002 |
Luis Adams |
28 |
Yes |
Yes |
Yes |
3 |
|
M0003 |
Matthew Quinn |
12 |
Yes |
No |
Yes |
2 |
|
M0004 |
Paul Torres |
22 |
No |
No |
Yes |
1 |
|
M0005 |
Priya Novak |
10 |
Yes |
No |
No |
1 |
|
M0006 |
Amy Fisher |
36 |
Yes |
Yes |
No |
2 |
|
M0007 |
Jason Scott |
22 |
No |
Yes |
No |
1 |
|
M0008 |
Sandra Ward |
9 |
Yes |
Yes |
Yes |
3 |
|
M0009 |
Richard Gonzalez |
8 |
Yes |
Yes |
Yes |
3 |
2. Don’t stop at simply knowing if those hallmarks exist. Develop a way to gauge which is most important or how strongly a marker indicates loyalty. Scoring is the most common approach.
This is where an AI tool starts to carry its weight. Once you have an adequate data set, you can ask your AI tool to help you look at number of years of membership and find the relationship to the markers.
Find all of the members with at least one of the following markers. Assign that person a score of 1. Find how many have two of the following markers. Assign that person a score of 2. Your tool should get the idea and be able to iterate from there.
Now find the relationship between the number of markers and years in membership. For example, how many additional years of membership are reflected for each additional score for positive markers.
This should help you prove (or disprove) a proportionate relationship between the positive markers and years of membership. That relationship may or may not exist, but this is a lot faster than what we’ve done in the past.
My sample data won’t work for this purpose because the information is randomized and bears no actual relationship.
However, even the randomized fake data showed a relationship – albeit statistically and factually invalid.
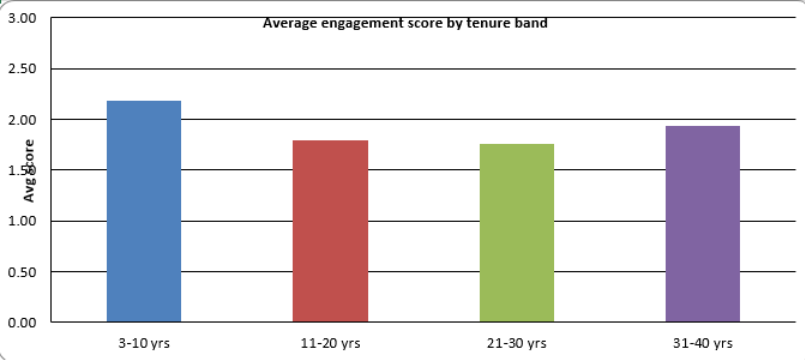
Here is what Claude told me when I asked if this was possible.
“There’s no meaningful relationship between years of membership and engagement score in this data. The trend is very slightly negative, and it’s small enough to be chance. That’s what we should expect: when I built the data, years and activities were assigned randomly and separately, so nothing ties them together.”
I don’t know about you, but I really like an honest AI.
Read a future post on what Claude wisely reminded me about loyalty! (Hint: Years of membership is a heavily flawed gauge of loyalty (or unlikeliness to churn).
3. Now, consider whether specific combinations of markers are most indicative of loyalty.
Here is how we would do that.
Compare every combination. Three yes/no activities give eight combinations, from “none” to “all three.” Build a pivot table with one row per combination, showing the number of members and the average tenure. This is easy to explain to a board, and it shows patterns like “committee plus annual meeting renews at 92%, but committee alone renews at 78%.”
Test whether combinations add something beyond the individual activities. This is a little more complicated, so we will explore this in a different post, but the basic concept explores whether someone who does both A and B is more likely to have a longer tenure than someone who does both A and C.
4. Now it’s time to apply this same thinking to a different data set. Let’s look at recently dropped members and apply the same thinking in reverse. Let’s score them and see if our lowest scores equate to the shortest tenures of membership. And when I say “let’s”, I mean your AI tool.
At the very least, you should be able to understand if your lowest scores are reflected in your drops with the shortest membership terms(churn).
If, at this point, you’re not getting actionable results, consider whether you can introduce larger data sets (more members or dropped members) as well as more markers and ask AI to go back and do the work again against the larger set.
5. When proving a negative, consider whether the likelihood of churn is proportionate to the number of negative markers.
You can have a loyal member who does not attend annual meeting. Maybe travel is hard for that person. Maybe they just don’t have the budget. The question is, can you have a loyal member who does not attend annual, who participates in no volunteer committees, attends no other events, and does not have a complete customer profile. Are those the folks most likely to drop?
Are you asking yourself if we live in the Land-of-Make-Believe?
If you got this far, you might be seething because you are wondering how to get some of the data points you think will be the strongest indicators. Trust me when I tell you that we know that’s not easy and it takes a lot of cleaning with some data sets.
You may remember the beginning of this post when I mentioned Jeremy Furniss and that he works with not only membership development but also data science. Here is a very, very important note. Jeremy does not have a team of ten people sitting in a data center crunching numbers. One could argue that his staff has less than one FTE doing majority data science.
In truth, this is where your AI tools should be doing some of the heavy lifting of analyzing and even cleaning data. Very few member-based organizations can afford the time and people for advanced data analysis outside of those who focus on complex industry data.
Start small. Start manageable.
And in closing, remember that taking action on what you find might mean picking up the phone or putting together a personal email. Jeremy and AOTA did some hard work to uncover the members who did not join despite having valuable positive markers. Now the real work begins to win them back.
However, at least the team doing the work of trying to re-engage those churning members has a highly informed list from which to work. And, once those calls are made, the findings from those conversations can go back in and inform the AI learning so that next month’s list is even better.
Let’s all wish Jeremy and his team good luck and stay tuned for some of those results and how our good buddy, Claude, pitched in.
 RSS Feed